Like list of students join between 12th January 2009 and 2nd February 2009.
These kind of reports are easy to make using SQL Server Reporting Services.
But what if we want to use Microsoft Performance Point.
Following are the screen shot and steps require building a report using a date range.
1. Creating a simple report (in screen shot I am taking [Time].[Year - Half Year - Quarter - Month - Date].[Date] on the Y-axis so that we can see that filters are working properly.)
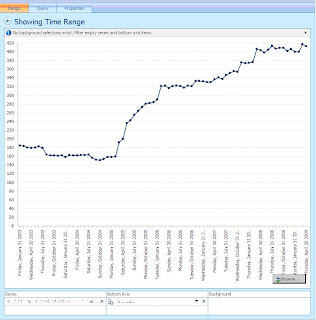
2. On the Query tab adding two parameter Range1 and Range2
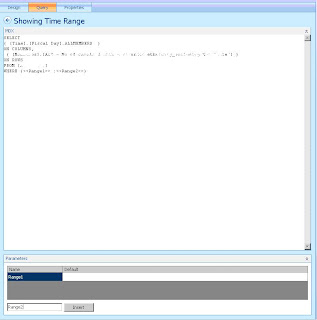
3. Editing MDX as shown in Screenshot

Changing the [Time].[Fiscal Day].Allmembers to [Time].[Fiscal Day].[Fiscal Day] so that we don’t have column named “all” in the report.
Inserting where clause -
WHERE {<
4. setting default values for the parameter Range1 and Range2

Here I am giving [Time].[Date].&[2008-05-21T00:00:00] as default value for one of the parameter.
The reason of taking different attributes in parameter and on Y-axis is that for same attribute it won’t work.
5. Now on the Design tab we can see that it is showing only those columns which comes under Date Range.
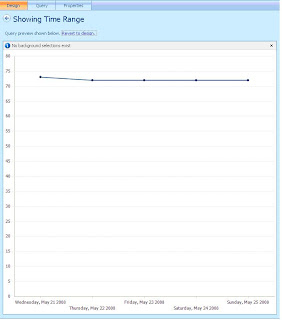 sss
sss6. Now creating two filters named From and To in dashboard, Filters are member selection filter based on [Time].[Date]
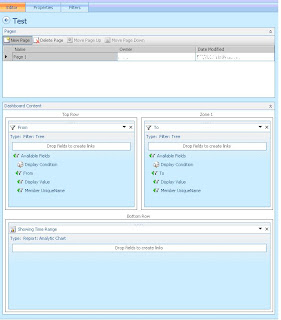
7. Linking the reports to the filter. Remember that’s Dashboard item end point for from is Range1 and for To is Range2. Source value should be Member Unique Name.
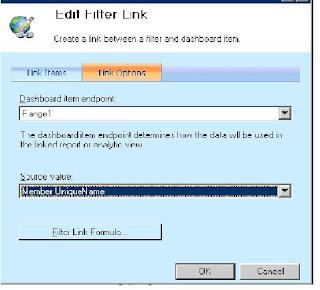
8. Publish dashboard and Preview.
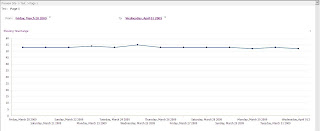
In preview we can see that it is showing data between a date ranges.
But taking Tree or Drop down Box is not useful as its not have ease of use.
We can even use calendar instead of it.
For using calendar in filters. We have to use Time Intelligence Post Formula Filter.
For using any Time intelligence filter you have to configure the time settings of data source.
Go to data Source --> Time Tab ... See the screen shot.
Configure it in a way it is showing in Screen shot.
(For more information on configuring time Intelligence Filters Please refer http://office.microsoft.com/en-us/help/HA102408431033.aspx )
After configuring data source. We create two Time intelligence Filter From and To.
Then link the filter as per the screen shot
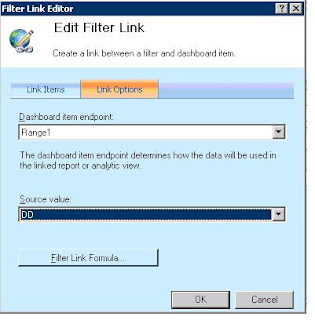
After that click on the Filter Link Formula…
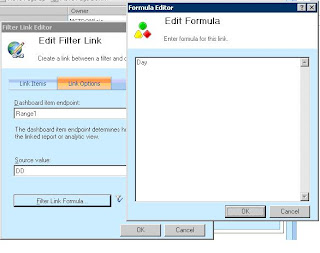
And insert Formula by typing “Day“.
Formula “Day” means we want day level data. Other options like Month, Quarter can be used.
After it publish and Preview it.
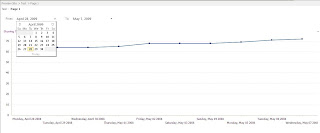
In the Screen shot you can see that how can a calendar control works.
Thanks,
Gaurav Gupta