Getting Started....
Microsoft Power BI is
reach of features, rich graphics and supports numerous data sources.
To use MS Power BI
features you have to signup here. https://powerbi.microsoft.com/
- User your organization Email Id for signing up.
Microsoft will use your Organization Office 365 Licensing for this.
- It verifies your organization email id and
Password.
- You will get free access but will be limited to few sources and samples only.
- To have full access you need to purchase Power BI Pro features.MS provide a 60 days trial pack for pro features :-)
- Once sign up it will take few seconds to setup
a Power BI work environment for you.
- Following which it will allow you to connect
to you with multiple data source options within or outside your
organizations
- Here I am creating a sample data source using
Xlsx (Local File Source) as Source
- you will get following like environment
- It same as Excel Pivot with little bit
different layout but more charts like MAPs.
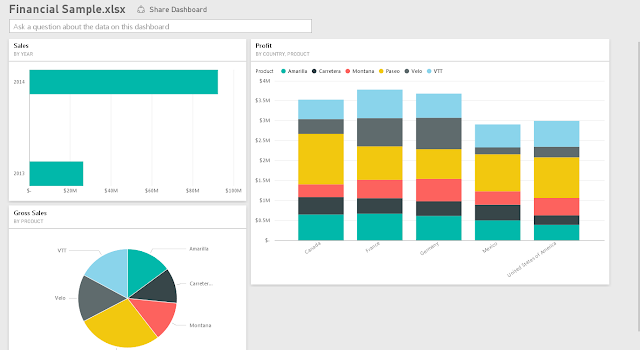
- Following is a sample report-
- Overall dashboards will look like
Well I have just started
here. Please look for more on this in coming days…………………..


thank u for giving this best information..we are offering the best msbi online training ..
ReplyDeleteIntelliMindz is the best IT Training in Bangalore with placement, offering 200 and more software courses with 100% Placement Assistance.
DeletePower BI Course In Bangalore
Java Training In Bangalore
LoadRunner Training In Bangalore
Building Estimation and Coasting Course In Bangalore
This comment has been removed by the author.
ReplyDeleteThis comment has been removed by the author.
ReplyDeleteMicrosoft has actively sustained what they call “a blistering pace of innovation” and, whilst listening to user needs, they continue to update Power BI with monthly updates.
ReplyDeleteMicrosoft Power BI is new, but excitingly it’s evolving virtually on a monthly basis.
So just when you realize how brilliant the Power BI tool is, you suddenly discovered it’s just got even better!
Data Bear Data Bear is one of the many companies helping clients with this powerful self-service business intelligence (BI) offering, and it didn’t take long for their team to identify Power BI as a serious game changer.
Specializing in business intelligence consulting, Data Bear founder, Johann Joubert, believes Power BI has become the single most powerful tool for businesses to use to ensure the full range of businesses are ahead of the rapidly changing BI world and the opportunities it offers.
Find More : Power BI Reports
Thanks for very usefull information,
ReplyDeleteIt is very useful to who are searching for msbi online training.
Hi,
ReplyDeleteSQL Server Integration Services (SSIS) is a component of SQL Server which can be used to perform a wide range of Data Migration and ETL operations. SSIS is a component in MSBI process of SQL Server.
This is a platform for Integration and Workflow applications. It is known for a fast and flexible OLTP and OLAP extensions used for data extraction, transformation, and loading (ETL). This is a great post. Thanks For Sharing. I just wanted to share information about Microsoft Business Intelligence Online Training.
Thanks for sharing this Informative content. Well explained. Got to learn new things from your Blog onpower bi online course
ReplyDeleteNice post about Power Of POWER BI.
ReplyDeletemsbi training institutes in hyderabad
Good post..Keep on sharing....
ReplyDeleteMS Power BI Online Training
Power BI Online Training
Power BI Training
Power BI Training in Hyderabad
MS Power BI Training in Hyderabad
So nice
ReplyDeletePower BI Training In Hyderabad
Power BI Training
Power BI Online Training
Power BI Training Online
Power Bi Training In Hyderabad
ReplyDeletePower Bi Online Training
Very useful blog for beginners who look opportunity in Power BI. If you are looking for Real-Time Power BI Course in Bangalore Contact Boyina Soft for demo class.
ReplyDeleteExcellent collection of information...Thanks for sharing the information...
ReplyDeletepower bi training in bangalore
This comment has been removed by the author.
ReplyDeletethank u for giving this good information..we are offering the great
ReplyDeleteFull Stack Training in Chennai | Certification | Online Training Course| Full Stack Training in Bangalore | Certification | Online Training Course | Full Stack Training in Hyderabad | Certification | Online Training Course | Full Stack Developer Training in Chennai | Mean Stack Developer Training in Chennai | Full Stack Training | Certification | Full Stack Online Training Course
Thanks for sharing this Informative content. Well explained. Got to learn new things from your Blog on
ReplyDeleteIELTS Coaching in chennai
German Classes in Chennai
GRE Coaching Classes in Chennai
TOEFL Coaching in Chennai
spoken english classes in chennai | Communication training
Thank you for sharing this article,it is will be helpful and very Unique..
ReplyDeleteKeep updating...
Learn Power BI
Tree maps Data Visualization Services are a great alternative to pie charts when you have a lot of data to present, but they're not easy to design. In this post, we'll look at examples of poor tree maps and how to improve them with small changes, whether that means adjusting the colors or fonts, using more space, or adding a few simple details to your tree maps.
ReplyDeleteThis comment has been removed by the author.
ReplyDeleteInteresting blog, here a lot of valuable information is available, it is very useful information.
ReplyDeleteBest SAP Security & GRC Training Institute In India
SCCM & Intune Online Course from Malaysia
Best Dell Boomi Training from Hyderabad
AWS Certified Solutions Architect Online Coaching In Australia
Best SQL DBA Online Training
Exchange Server Online Course from India
Best Mean Stack Training from South Africa
.Net Training Institute In Hyderabad
Informatica Training from Pune